Part III - Focusing on the Customer Which One? http://qualityg.blogspot.com/2006/09/quality-misc-customersupplier.html
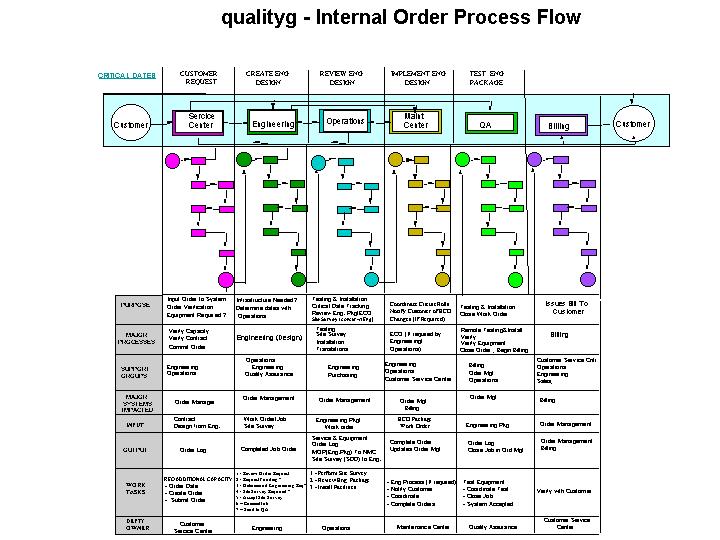
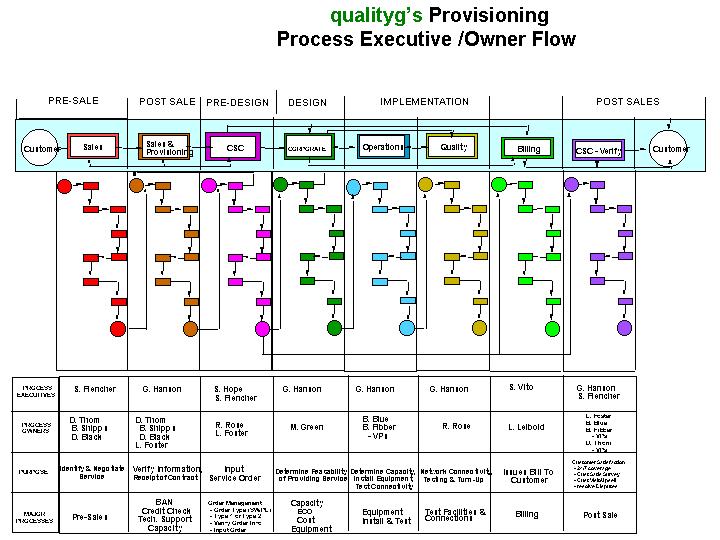
Part IV - SIPOC Model & Internal Process Model
http://qualityg.blogspot.com/2006/09/quality-misc-customersupplier_11.html
PART II - Supplier Evaluation Program
I heard on the news this morning that Chrysler is planning to be more responsive to customer wants/needs and that involves keeping its suppliers close.
Chrysler just celebrated the launch of production of the 2007 Jeep Wrangler and Wrangler Unlimited at a new assembly plant it operates in conjunction with three suppliers and calls the Toledo (Ohio) Supplier Park. The idea is to share the risk of building a new plant and cut equipment and labor costs.
I'm not sure if this practice is being done in other places in the United States but I applaud the effort and hope this can be a model for other customer/supplier partnerships.
In order for this to work each side will need to be honest, open and confidential in there operation and agreed upon measures of operations.
I have written the following letter (generic) as an example of how a supplier evaluation program might be measured:
Example - Supplier Performance Evaluation Program
My name is qualityg and I am the Central Region Quality Manager. I received your Email and wanted to provide you with some comments and suggestions.
I applaud your group’s effort in developing a Supplier Performance Evaluation Program. Key Suppliers doing business with QGINC should be provided a Process defining what requirements qualifies them to do business with QGINC, as well as what it takes to continue to do business with QGINC on a pre-established (i.e.; > 12 months) going forward basis. It is also vital to our Quality Efforts to deal with potential problems in a proactive and preventive manner as far upstream as possible when dealing with potential Supplier input problems.
As you know the vehicle for determining this is a “report card” or “evaluation report” that will provide QGINC with objective data that measures supplier’s performance in key dimensional areas that affect our customers’ service.
From a Total Quality perspective we need to make sure the final measures and objectives selected from this process are communicated back to the initial Supplier Selection Process so that potential suppliers in the future can be selected based on their performance(s) with their current customer base. By establishing these type of requirements up front will create a benchmark for ongoing process improvement throughout the partnership.
One important factor I learned a few years back when I was involved in a customer/supplier partnership program between my then employer (ACME) and Styme Chemical was that both parties should be measuring the same elements with the thought that once the supplier becomes “Certified” the customer will no longer rely on their measures but solely on the suppliers measures.
In a Total Quality Environment we should strive for Single Source Suppliers who become true partners in serving our customers. This also reduces our costs associated with measuring, inspecting and checking on our suppliers. It is the Suppliers responsibility to provide and exceed our expectations. It is then our responsibility to provide the Supplier with those requirements in a definable and measurable manner.
You indicated that many of the measures would have to be tracked manually. Does this mean that each section will manually track each measurement (if applicable) and forward the results to a group that will create an output report? I have found in the past an output report or “Report Card” that is weighted provides a benchmark for on-going process improvement and root cause analysis.
Following are some suggestions, comments and examples:
SUPPLIER OUTGOING PRODUCT QUALITY
Key suppliers should be required to provide QGINC with Trend Chart information describing their track records in the areas that they are being contracted to do business for QGINC (i.e. On-Time Delivery, Installation etc.).

Another area of consideration is to select those suppliers who currently have or are in the process of achieving a Quality Supplier Registration or ISO 9000 Registration. The main purpose of becoming registered to ISO 9000 is to ensure your customer that you have a Quality System in place and that you have the documentation, procedures, measures, and charts to prove compliance to their requirements. Many companies are finding it more cost effective to have an independent 3rd Party Auditor review the supplier rather than incurring the cost themselves since the supplier must pay for the initial registration audit and the on-going (aprox. every 6 months) surveillance audits that are a requirement of ISO 9000.
SUPPLIER INCOMING PRODUCT QUALITY
Supplier Incoming Product Quality is the measure of product quality after the product is delivered to QGINC and put in operation. How could we measure the response time for a Field/Engineering complaint when the product or service is not performing as expected?
Example: Product Quality and Response is weighted at 25 Points
QGINC requires that once a complaint (event) is communicated to the
Example: Product Quality and Response is weighted at 25 Points
QGINC requires that once a complaint (event) is communicated to the
supplier they shall have 24 hours (1 day) to correct the situation.
Scale: No complaints during evaluation period = 25 points
Each complaint (event) has a deduction of 1.0 point and an additional point
Scale: No complaints during evaluation period = 25 points
Each complaint (event) has a deduction of 1.0 point and an additional point
will be deducted if it’s not resolved in 24 hrs.
Measure: Time Called 2:00 PM 10:00 PM 6:00 AM 2:00 PM
Point Deduction .25 .50 .75 1.0
Measure: Pareto Chart of Major Complaints for Root Cause Analysis
SHIPMENT AND DELIVERY QUALITY
Shipment Quality is the measure of Supplier Performance against requirements involving the shipment of materials to QGINC.
Example: Shipment Quality is weighted at 20 Points
QGINC requires that all orders be properly labeled according to contract
specifications
Scale: No defects (non conformances) during evaluation period = 20 points
Each order that contains one or more of the following non-conformances will
be deducted 1 point.
- No Purchase Order Number
- Purchase Order Number Missing Digits/Incorrect
- No Package Slips
- No Quantity on Package/Carton
- No Description on Package/Carton
- Claims (Overage, Shortage, and Damaged. Wrong
Material, Agreed Cost & Invoice Don’t Agree,
Transportation Charges Don’t Agree, Item Quantity &
Invoice Don’t Agree)
Measure: # of orders - # of valid non conformance events = _____ x 20 points
/ # of orders
Measure: Pareto Chart of Non Conformance’s for Root Cause Analysis
Delivery Quality is rated by measuring the supplier’s percentage of “On-Time” Deliveries.
Example: Delivery Quality is weighted at 20 Points
QGINC requires that all deliveries be to be made in the contracted specified
period of time. QGINC also encourages its suppliers to use QGINC approved
carriers.
Scale: All On-Time deliveries made = 20 points
Points for this measure are calculated by taking the suppliers actual on-time
delivery percentage multiplied by the 20 points possible.
Measure: % On-Time Delivery X 20 Points (i.e. 85% X 20 = 17 Points).
Additional Items for Consideration
I would also like to suggest a few additional Dimensions to be considered for Product and Service Quality.
1) Product Quality (Hardware and Software)
DIMENSIONS
Hardware:
1. Failures
2. Conformance to Standards
3. Mechanical/Physical Components Fit For Use
Software:
1. Conformance to Standards
2. Installation Failures and Problems
3. Software Errors
4. Patch Management and Administration
Possible Data Sources: Example Measures:
QGINC Purchasing/ Engineering - #/% of Engineering Complaints
QGINC Operations - #/% of Field Problems
QGINC MIS - #/% of Software Errors
#/% of Patch Jobs
Supplier(s) - Measure the Same as QGINC (if applicable)
Charts/Graphs: Control Charts, Trend Charts, and Pareto Charts
2) Product Reliability
DIMENSIONS
1. Service Interruptions/Outages
2. Failures
3. Current Capabilities/Features Negatively Impacted by new Releases or
1. Service Interruptions/Outages
2. Failures
3. Current Capabilities/Features Negatively Impacted by new Releases or
Patches
Possible Data Sources: Example Measures:
QGINC Operations - Length (Time) of Outage
#/% of Failures
QGINC Engineering/MIS #/% of Capability/Feature Failures as a result of
new Releases/PatchesPossible Data Sources: Example Measures:
QGINC Operations - Length (Time) of Outage
#/% of Failures
QGINC Engineering/MIS #/% of Capability/Feature Failures as a result of
Charts/Graphs: Control Charts, Trend Charts, and Pareto Charts
3) Product Documentation
DIMENSIONS
1. Availability of Documentation
2. Ease of Use (Complete and Readable)
3. Help Desk (Phone and Internet)
Possible Data Sources: Example Measures:
QGINC Operations, Sales, Eng. Documentation Available (Y/N) or % of Events
Ease of Use (Y/N)
Help Desk Providing Answers (Y/N)
Charts/Graphs: Trend Charts, Pie Chart, and Bar Chart
4) Installation /Repair
DIMENSIONS
Consider adding the following:
1. Repair Performance
2. Service Interruptions
5) Engineering/Technology
DIMENSIONS
Consider adding the following:
1. Support Staff Availability and Competence
2. Emergency Procedures (i.e. Response Time)
3. Documentation
4. Change Notice Management
6) Training - Consider adding Training as a Factor
DIMENSIONS
1. Availability
2. Effectiveness
3. Competence of Instructors
7) Anticipate Our Needs
DIMENSIONS
Consider adding the following:
1. Conformance to QGINC Standards and Interface Specifications - Supplier
Consider adding the following:
1. Support Staff Availability and Competence
2. Emergency Procedures (i.e. Response Time)
3. Documentation
4. Change Notice Management
6) Training - Consider adding Training as a Factor
DIMENSIONS
1. Availability
2. Effectiveness
3. Competence of Instructors
7) Anticipate Our Needs
DIMENSIONS
Consider adding the following:
1. Conformance to QGINC Standards and Interface Specifications - Supplier
should work toward providing Products and Services that meet QGINC
Standards. Suppliers should also provide interfaces that are open
architecture so in the future QGINC is not forced in to one supplier where
it would be costly to consider a different supplier.
2. Planning and Design - Supplier should participate in joint Planning and
2. Planning and Design - Supplier should participate in joint Planning and
Design Sessions.
Measures/Outputs
As you mentioned in your Email, Data Base Integrity and the timeliness and accuracy of the input measures are essential for a Supplier Performance Program.
Factors and Measures that are Subjective nature usually require a Supplier Evaluation Survey to be developed so those QGINC internal groups who deal with our suppliers can respond in a rated, scaled or weighted format based upon their perceptions of the subject matter in question.
Though not mentioned in your Email, I am assuming the output of the Supplier Performance Program will be a “Report Card” that will serve as the starting point for continuous process improvement. QGINC should encourage the use of joint Quality Action Teams that will benefit both companies and create a win-win relationship.
Closing
Thank You for allowing me to participate, I hope my suggestions and comments will be value added to you.
Next - Internal Customer/Supplier Partnerships


 I started to wonder how many parents actually knew the person teaching their child is only a few years older than their child and may or may not have as much application in the field that they are instructing.

