Wednesday, July 26, 2006

Wall Street says GM Leadership restructuring is "Like Putting Lipstick on a PIG" - Update 7/26/06 - Wall Street Loves You Today GM


Wall Street Investors keep telling GM Leadership they should have fewer brands, fancy designs and close more plants.

For example, one of General Motors' restructuring announcement's was met with "like putting lipstick on a pig", in the words of Shelly Lombard, an analyst at Gimme Credit.

Is anyone else sick & tired of hearing and reading what Wall Street likes and dislikes? Here is a person from "Gimme Credit" making a pig statement about GM. Wow, that statement is so original and bold it realy entices me to want to do business with a group called "Gimme Credit." WS analysts are nothing but short-term vultures that wait around until a company posts figures and then they swoop in to divide the stories. And, the business of setting projected quarterly earnings outlooks is a crock, I wish Steven and Stephen (Freakonomics) would do some research about WS analysts like they did on Real Estate Agents (Real Estate Agents).

I know GM is having problems, I have written about them ( GM to close more factories updated 6/8/05) in the past.

GM (Ford too) would stop reporting quarterly to the Wall Street Journal. Be Like Berkshire Hathaway (Warren Buffett) and tell them to take a hike when it comes to future guidance reports. In case you have not noticed Wall Street hates you anyway.

update 7/26/06

General Motors Corp. said Wednesday it lost $3.2 billion in the second quarter as it absorbed heavy charges for its massive restructuring program. But the world's largest automaker reported an adjusted profit without the charges that handily beat Wall Street estimates and its sales surged 12 percent. "If there was ever a time when GM needed to look good, this is it," said John Casesa of Casesa Strategic Advisers. - "But John, will you still love me tomorrow?"

"We were underwhelmed by General Motors' big announcement of future plant closings and job cuts," Shelly Lombard, a senior research analyst with Gimme Credit in New York, said in a note to clients on Wednesday.

qualityg says... is Gimme Credit located New York City really mean "Gimme Yo Money Punk?" Now she says GMs big announcement about their plans stink. Maybe they do, by what method do you personally use that gives you the right to make statements like this? It can't be because you work on Wall Street and what you and others on WS say is rock solid. Ms. Lombard, is it your degree from Columbia or your 17 years of working in the credit industry that allows you to make statements about GM and other companies?

I'm telling you folks, especially you UNION members, you best get your acts together and start forming new groups and leadership. How can you stand back and allow punks from Wall Street make statements on financial figures that no one knows if the numbers are correct? Financial Figures are result figures and anyone can stand back and shoot darts when the figures are posted. Making asinine statements like "I think they should close more plants," really means, hey I'm on Wall Street, I'm quoted in the paper, you slugs working in the plants are and should lose your jobs because my company "Gimme Credit" ran some formulas and says it is so. Ms. Lombard please come to Flint Michigan and work in the plant for a month. At least then I might consider some of what you say to be accurate. Perhaps you might even make a statement before you know the results!

Wow here is another financial analyst making an after the fact bold and predicting statement...

"While a step in the right direction, GM's turnround doesn't appear sufficiently aggressive to us," says Rod Lache at Deutsche Bank in a report. He adds that the revenue side of the equation was also a concern, with GM achieving the lowest average price per car sold in the industry thanks to its mostly lackluster line-up of models.

qualityg says ... Mr. Lache - What the heck does "Doesn't appear sufficiently aggressive to us,"mean? Please define "Sufficiently Aggressive?" Here is another sufficiently appropriate statement "You can kiss a Buick's Ass!"

Ms. Lombard was that pig statement a self-portrait?


related post about GM @ http://qualityg.blogspot.com/2006/07/quality-fools-gm-death-watch-part-vii.html

For some great reading about GM and Cars in general check out "The Truth about Cars" @

http://www.thetruthaboutcars.com/

Saturday, July 15, 2006

High School MEAP Scores for 2006 - Another example of the demise of our educational system"

2006 MEAP Test Scores Stink Worse than 2005


Only 52.37% of the students in the graduating Class of 2006 were proficient in math, compared to 56.85% in the Class of 2005. In science, the percent dropped from 58.4% to 56.77%; in writing, from 57.25% to 55.19%; and in reading, from 77.88% to 70.08%. In social studies, 36.79% of the students in the Class of 2006 were proficient, compared to 33.83% in the Class of 2005.


qualityg says ... The numbers are sad. The News release is really sad and more proof the School System is in a state of demise..


Post ON MEAP From Fall 2005


qualityg is still watching you


OK, I have written on this before and if you think I’m going to stop you’re wrong! Please start looking at the big end-to-end picture. You may want to read the post (“We’ll Be Watching You") from April/May post on the same subject as a pre-requisite (one of many on site).

I have color coded some words and paragraphs that should be answered and in some cases questioned further (I ask some). Please remember, I’m just a concerned parent, I have no political or educational stake (i.e., job) at risk, just the future of our children.

If you care, pass on to someone else that needs to know what lays ahead for our Education System.

In the 2005 Michigan Educational Assessment Program test, 5.4% fewer students met or exceeded state standards in science, compared to the 2004 test.

Reading test scores, which jumped by nearly 10 percentage points for the Class of 2004 compared to 2003, showed a continued increase for the Class of 2005. The 84,729 students (77.9 percent) from the Class of 2005 who met or exceeded state reading standards increased nearly two percentage points over the Class of 2004, 80,214 students (76.2 percent).

Results in the other subject areas assessed show declines as compared to previous classes. In Writing, 62,604 students (57.2 percent) of the Class of 2005 met or exceeded state standards compared to 60,979 (57.8 percent) of the Class of 2004. In Mathematics, 62,135 students (56.9 percent) of the Class of 2005 met or exceeded state standards compared to 62,109 (58.7 percent) from the previous class.

In Science, 63,102 students (58.0 percent) of the Class of 2005 met or exceeded state standards compared to 66,901 (63.4 percent) of the Class of 2004.
qualityg says… this reads like an improvement.

The number of students in the Class of 2005 who met or exceeded state standards in Social Studies was 36,151 (33.8 percent) compared to 36,026 (35.0 percent) for the class of 2004.
qualityg says… this is disgusting, do you see what is happening, we have tampered and distorted the whole for the few! What about Art, Dance, Drama, Band, where are they? That’s right, can’t measure them so they drop to second-class status. It's about balance, it's about working together and pulling in the right direction.


The state Board of Education has a special meeting planned for July 28 to discuss high school issues.
qualityg says… I’ll be watching, will this meeting be open to the public? If so where and at what time?

"We're viewing these scores right now as support for the fact that Michigan does need to revise its high school standards in all areas and make them more rigorous," Hughes said.
qualityg says… you are in a reactive mode and you have no reliable facts or data shown on your web site, please provide others that can substantiate this claim?

School districts are viewing the science scores with concern and want to see what's working and what isn't, said Suzanne Klein, superintendent of Grosse Pointe Public Schools, where high school science scores slipped a couple of points from last year.
qualityg says… are you telling me you are not doing this as a whole, but each district will decide? Folks, these are after the fact result measures, where are the process measures that alert you to problems, there are none. This process is NOT stable; in fact it’s OUT OF CONTROL. What is the Process?
Gayle Green, assistant superintendent for curriculum for the Macomb Intermediate School District, said it's important to keep the scores in perspective.

If the district "dropped six points and the state's dropped six points, that's probably a function of the test," Green said.
Dr. Deming says … You should not ask questions without knowledge.

Other scores fluctuated, but not by significant amounts. In reading, 1.7% more students met or exceeded the state standards and fewer students scored in the lowest level. Green said the two-year reading trend, with an 11.7% increase thanks to a 10% jump last year, is good news because it shows the improvement continued into the next year.
qualityg says... how can we continue to use numbers for our children, there is no pain in numbers, show me the faces of the students who are not measuring up to a system where there will always be variation.

"One year does not make or break an achievement score and one year does not make or break a trend," Green said.
qualityg says…what trend? If you think Bar charts shown on the “Trend Reports” listed below they do not tell the story. Bar charts are categorical. Control Charts will show Trends, and will let you know if process or test is stable.

All other categories were down slightly, including a 0.6% loss in writing; 1.8% drop in math and a 1.2% loss in social studies. With the exception of science, the changes between 2004 and 2005 were insignificant.

"Every test is independent of every other test, so a little bit up, a little bit down, it's statistically meaningless," said David Plank of the Education Policy Center at Michigan State University. "It's random noise."

qualityg says… this is not noise, “By what Method” do you make this statement. Please provide data. I see no control charts that show stability, I see tampering from year to year in trying to hit a moving target, if statistically meaningless, why measure at all! Two terms often used in describing the types of variation are signal and noise. Variation that is expected, usual and typical is called noise. Variation that is really unusual and unexpected is called signal. We must understand the difference in signal and noise before we can properly respond to either.

qualityg recommended (even sent an Email) in May to Dr. Plank – “I learned from a very wise man (Dr. W. Edwards Deming - http://deming.org/) that when you’re dealing with statistics it’s best to be trained by a master, if not more damage can be done. Not falling into that category (I consider myself an applicationist) I would suggest Mr. David Plank co director of the Education Policy Center at Michigan State University contact an expert from their Statistics Department (preferably a theoretical statistician). Please ask that person to explain Dr. Deming’s Funnel Experiment before you continue to recalibrate a system that sounds like it is out of control.

MEAP Summary Reports (following reports produced by the Michigan Department of Education)

HS Class of 2005

Friday, July 14, 2006

"High School & College Dropouts, - "Dropouts: an epidemic" See update - 07/14/06

6/21/06

I often wonder if there is any correlation as to why high school and college students dropout?

Currently for high school studies indicate three out of every 10 students who enter high school this year will not graduate in the typical four years. That sure is a whole lot of children left behind Mr. & Mrs. NCLB Act!

I have not done an exact study with trend facts or figures but my 30 years spent
in a classroom as a student and instructor tells me there is no single reason why students drop out of high school. I have seen different reasons: feeling of not belonging (no guidance from parents or school professionals); school is boring I’m telling you in many cases this is true); no motivation (see the previous two reasons); faulty and non-standard testing procedures; and the lack of constancy of purpose (no aim, no vision and have no way to know how to get there).

I don’t have scientific facts on college dropouts but I can tell you from a time spent(graduation parties and announcements) and money giving perspective that a lot more people graduate from high school than from college.

I believe the reasons I stated above all can be stated for college with the addition of a big one and that is money/dollars. Using Michigan as an example state support for education has declined for at least 20 years.

One solution in the works might be …Michigan’s Governor Jennifer Granholm is currently pushing
through legislation her “New Merit Award” scholarship ( http://www.mich.gov/som/0,1607,7-192--145798--,00.html) that will provide $4000 in scholarship money to every student who wants to earn a college degree or technical certification.

The long-term goal is to have more Michigan residents graduate with new skills and to
be able to find jobs in the state.

She has also called for stricter educational requirements for graduation. See
http://qualityg.blogspot.com/2006/04/
quality-education-see-update-41106-am.html


The governor’s new project may help with some financing but what about BOREDOM?

I would like to concentrate on this subject because I believe this academic disease crosses all grades of education.


I wonder if BOREDOM sets in because we have not changed our educational approaches to teaching in decades. Our schools were designed years ago to meet the needs of an agricultural and industrial environment. Perhaps if we can establish a standard for learning and a design plan that builds a foundation that meets today’s and tomorrow’s needs we will have a chance to put “Joy of Learning” back in to our schools and reduce the academic cancer known as BOREDOM.

Just last night during a college class I heard over 10 people complaining, “his is the worst and most boring class I have ever taken (at least since last semester).” “All he does is put up the authors on-line PowerPoint presentation and then gives us the authors True & False questions as a quiz to see if we listened and done our reading.” “There is no class discussion, it’s his way or the highway (no it is not Sparky Anderson).” “If this was not a required class and I need it to graduate I would drop this in a second.”

Why do we allow this type of behavior to continue at all levels of our educational system? Those educators that still believe the measure of educational success is to see how many students I can fail or hold hostage (absolute power) in a class need to retire and go back to the farm.

New teachers and instructors entering the educational system are like business people who go to company training to learn new methods and skills and find out when they go back to their job the environment and their bosses will block any effort of change.

I know money can’t buy everything, but I am hopeful in the near future that Bill Gates and his wife Melinda and their foundation can ignite some new thinking and change in our educational system. Foundation is a grand word, because education needs a new one that creates standardized evaluations for
learning and creates the consistency that the system needs to really know who is learning and what schools are providing good education.


Updated 6/23/06

More on Drop-Outs...

A new study shows that only one in four students in Detroit graduate on time. Out of the 50 largest school districts in the United States this puts them dead last. Why?

http://www.freep.com/apps/pbcs.dll/article?AID=/20060621/NEWS01/606210441&SearchID=73248529505947

EXAMPLE OF WHY: LAST WEEK AT A HIGH-LEVEL EDUCATIONAL, BUSINESS AND POLITICAL SUMMIT ON MACKINAC ISLAND THE PRESIDENT OF THE DETROIT FEDERATION OF TEACHERS (JANNA GARRISON) SAID:

"What's good for the teachers is good for students."


Who is serving whom?

Unfortunately I don't think Ms. Garrison is the only teacher alone in this thinking.


Updated 7/3/06


Merit Award cancelled for students going out-of-state starting in 2007


On Friday June 30, 2006 Governor Granholm signed a bill starting in 2007 to eliminate the state funded Michigan Merit Award of $1000.00 for students going to college outside of Michigan.


I guess $1000.00 does not seem like much but it is estimated to save the state $3.5 million dollars and it will affect aprox. 3500 students.


qualityg says ...
again our legislators and governor fail to see the big picture (systems thinking). What about the student who wants to go into a program at a four year university and none of the state of Michigan colleges will accept him/her?


Example, I know of a student that wanted to go into a special economics program that was offered at a small number of select colleges. She applied at NYU, Maryland, Illinois and two seperate programs at the University of Michigan.


She was accepted at all the schools except Michigan where her parents and she pay taxes and where she has lived her whole life.


The kicker was she went and met the dean/advisor for the two programs at U of M and he discouraged her from applying, NOT because of academics but the fact the two programs cater to International Students. You know the kind that have to pay OUT-OF-STATE Tuition ($$$).


The worst part she is now taking out loans to pay OUT-OF-STATE Tuition ($$$).


What a scam these colleges continue to do to American Children and their parents. The schools will not admit to my statements, only to the fact they need more money, but they don't deny students for this reason.


My point is this about the cancellation of the Merit Award. If it can be proved that a state of Michigan college denied entrance to a state student, that student should still be entitiled to the $1000.00. In fact, I believe the student should receive the full award of $4000.00 and charge the state school who refused the student!


People wonder why we can't produce quality leaders and educators. Our Governor wonders why students are leaving our great state after graduation (fact - I have 2 nieces and 1 nephew that all graduated from Michigan State University in the last 3 years, they could not find jobs in Michigan and now they all live in Chicago, making money and having fun).
Do I need to say more?


Follow-Up - I sent this post to the Office of Scholarships and Grants <OSG@michigan.gov>.


Here is the reply:


"Thank you for your email. The Michigan Merit Award can not go out-of-state for the graduating class of 2007. Please feel free to contact our office if you should have any further questions."


AAGH, I don't think you read the post, if you did you did not understand it! I will NOT feel free to contact your office any further. --- qualityg

Other posts by qualityg on related educational topics:
http://qualityg.blogspot.com/2006/07/quality-education-no-way-schools-apply.html

http://qualityg.blogspot.com/2006/06/
quality-education-nclb-act-updated.html


Do you know whom
teaching your college student?


Danger Will Robinson

Quality Education

Update 7/14/06

Here is another excellent article on Dropouts by Tom Watkins who is a business and educational consultant. He served at Superintendent of Schools for the state of Michigan from 2001-2005. He can be reached at tdwatkins@aol.com - This is a man that knows!

Dropouts: an epidemic

go to http://www.hometownlife.com/apps/pbcs.dll/article?AID=/20060713/OPINION01/607130719/1202/NEWS12

Thursday, July 13, 2006

"Failing School Grading System" --> Baby Boomers To The Rescue!

Why I Dislike the School Grading System

This week ends another semester and I am beginning to hear through out the halls, bathrooms and school cafes complaints about the classes or I better get an A and I took this class because it was supposed to be easy (Minority). Oh there were the gleeful ones too that got high passing grades and feel justified that they mastered the subject (Majority). What I did not hear was how much was learned regardless of the grade. So then why do we need the current grading system? Why do we continue to teach only to the majority of students and how can we continue to fool ourselves about the millions of students (Minority) still being left behind?

Let me explain…

First we need to set up a scenario. Let’s say in our state we have one million students in grades 4-16 and our state test scores indicate we have 85% percent of our students (Majority) who have a Grade Point Average (GPA) of a C (2.0 out of 4.0) or better. That leaves 15% of our students who receive a D or below (Minority). Also included in the Minority group are school dropouts. Special Needs Children are in a separate study and not included in these figures.


The breakdown of numbers is 850,000 are passing and 150,000 are failing. Failing in this scenario does not mean being left behind in a grade or not passing a class, it just means below average.

I think most of us would agree that 150,000 students not learning is not acceptable. What if we had the same figures in nine other states that would mean 1.5 million students? Ouch!

This scenario makes perfect sense to me because what else should we expect when we teach only to the Majority? The foundation of our teaching methods is based upon what I call “basic reactive receiving” of information. I give you information, you remember information and I test you with feedback fill in the blank, multiple choice and true and false questions to see if you remember information. Does remembering = learning? Does learning = knowledge?

I’m not blaming teachers and I’m not blaming the curriculum. The foundation and environment that establishes our educational is flawed and has been for a long long time. The current approach “basic reactive receiving” serves the majority well, but is well good enough?

Charles Darwin said it is not the strong or even the smart that survive; it is the most flexible. There is the key word “FLEXIBLE.”


The following questions may help put some things in perspective:

- Why do students learn best when there is interaction with their teacher and or other students?
- Does interaction mean doing, instead of just basic reactive receiving?

- Why can’t there be enough experienced trained teachers to be able to teach in a regular sized classroom, plus a room for those who learn in smaller settings and for those who need one-to-one assistance (we do it for special ed, are there not regular ed that need this type of assistance?
- How much does self-esteem come in to play in order for a student to learn?

- Does that mean we all have to hit a jump shot to make the team of learning?

- I have been learning a lot working with Autistic and Asperger children when it comes to sensory integration. So why do we primarily utilize a few senses (see & hear)and not all of them including “common"?

- Is it not important to tailor fit approaches for both analytical (i.e., critical thinking, problem solving and innovation) and reflective (i.e., motivation, self- esteem) learning as well as basic reactive learning?

Are we sub-optimizing our student’s potential only using parts of our brain? Just think what knowledge our children could be learning if they could optimize their whole brain, and it would be fun, it would be “Joy of Learning (Deming)”.

I can hear some folks now “So what is new” and “Dream on qualityg dream on…”


BABY BOOMERS TO THE RESCUE


BABY BOOMERS TO THE RESCUE


We know that every student does not learn in the same manner so why do we continue to teach in the same type of environment and teaching methods. Is it the lack of dollars to have smaller classroom sizes? Is it the lack of knowledgeable and experienced teachers (knowledgeable and experienced do not mean “Certified”)?

I believe we have untapped gold mine that can help with many of the questions I asked above. It is the Baby Boomers who are looking for competent and meaningful work after they retire or take early buy outs. Many Baby Boomers are experienced and educated and would make a great resource to bolster the teacher to student ratio.

Now all you “Certified” teachers out there don’t get in a tizzy and go into a protective mode. I am suggesting Baby Boomers to be Aides and Teacher Assistants. Create a new position that will pay a decent rate. These types of Retired Baby Boomers are not looking for monetary gains or security, they are still looking to make a difference and find purpose for getting up in the morning.

We need to take monies slotted for other programs (not just in education) like individualized per student spending and create one pot to hire these new assistants. If children are our future then government and business needs to step up and prioritize dollars to education and quit cutting funds as soon as things get tough in the economy (again sub-optimization).

The following diagram ( Click on PIC to Enlarge) explains what I am saying, we are all in this together and there has to be a balance (optimization), for one group to go it alone is disaster (sub-optimization).


If you want proof look at the few teachers that are considered the best by your children. I bet it is the ones who inspire and encourage each student by utilizing all of their talents; the one’s who can take a large class and make each student feel important.

Want more proof? I am an example, I retired early, I am back in school, I am working in an elementary school, I feel good and I am making a difference.

I know there are good teachers who cannot or do not have these qualities, so let us give them some additional support.

Saturday, July 08, 2006

Where is the UAW when they are needed most?

Where is the UAW?

With all that is going on between GM and Kirk Kerkorian in the past few weeks I have heard very little from the UAW or any of their off shoot factions (i.e., Soldiers of Solidarity - SOS).

Oh sure the Union folks have articles and comments on their web sites and blogs but why are they not taking one side or the other or even their own platform in the public? Stand for something – right or wrong, who cares but do something.

BE A VOICE NOT AN ECHO

Now is the Time


Here are a couple quotes from The Detroit Free Press:

RON GETTELFINGER

"I do trust that Rick Wagoner and his team can get this behind him as quickly as possible and stay focused on what they were really starting to make inroads on, and that's moving General Motors forward."
- President of the UAW

RICHARD INCROCCI

"I think at some point in time, with the blessing of the union or the involvement of the UAW, it could be a good thing. ... One thing I might be slightly concerned about is Kerkorian wanting to replace Wagoner with Ghosn. I think Wagoner is doing a fantastic job. People need to give him time to incorporate what his plans are and what he wants to do."
- UAW member and assembly-line worker at GM's plant in Arlington, Texas

I again ask --> Where is the UAW? You want new members; you want to be a player again? Then get out in the field and quit sitting in the bleachers yelling threats and comments. NOW IS THE TIME!


BE A VOICE NOT AN ECHO


OK, THEN DO IT!
NOTE : qualityg is not a union member or affiliated with any auto company.

Thursday, July 06, 2006

Pareto Chart - construction, analysis & workshop - qg style

INTRO: Last week I posted a piece on identifying 3 kinds of problems at(http://qualityg.blogspot.com/2006/01/quality-tooltechnique-data-fact.html).

Also see Root Cause Analysis @ http://qualityg.blogspot.com/2006/07/quality-tooltechnique-root-cause.html


Below is a Quality Tools/Technique step-by-step example on how to construct a Pareto Chart with analysis and a workshop to help learn the tool better.

The Pareto Principle is very simple, yet very important. It is named after Italian economist Vilfredo Pareto, who, in 1906, found that 80% of the land in Italy was owned by 20% of the population.
What was most important about Pareto’s finding was that this 80/20 distribution occurs extremely frequently. For example, in general, 20% of your customers represent 80% of your sales.

Following that is a Pareto Workshop with PAL (Purpose, Agenda, Limit).

Pareto Chart Analysis is a visual tool that is used to identify the "critical few" problems that most impact our process. It is the search for significance. Most problems are due to only a few probable critical causes. This chart allows us to see which categories contribute most to the problem. We will gain more from our efforts by focusing on the most critically occurring problems.

Constructing a Pareto Chart (click on graphs & data to enlarge pic)

To construct a Pareto Chart, organize the data collected (usually from a checksheet) into categories. Categories consist of distinctly different groups of data. An observation placed in one category excludes it from belonging to another category.


Step 1: Total the raw data of each cause category and then determine the grand total
effect by adding together the effects of all the cause categories.
A Telecom Process Improvement Team developed a checksheet and asked the customer service reps to record the cause for each customer call about billing problems during a one-week study period. At the end of the week, the team collected the checksheets and tallied the results by specific cause.

Step 2: Re-order the probable causes from the largest to the smallest.
Step 3: Determine the cumulative-percent of total for each probable cause on the ranked list.

The cumulative-percent of total for a contributor is the sum of the magnitude of the probable cause and all the other contributors that come before it in the rank ordering, divided by the grand total, and then multiplied by 100. For example, the cumulative-percent of total through the fifth cause (Toll Related) in the rank order for our example is: The resulting table is called a Pareto Table or Cumulative Frequency Table.
Step 4: Draw and label the left vertical axis.

The units on the axis should range from 0 to a convenient point equal to or slightly greater than the grand total. In this case, the grand total is 73, so we construct an axis from 0 to 80. Always provide a heading on the axis to describe the measure being used.

Step 5: Draw and label the horizontal axis.

Divide the horizontal axis into the same number of equal divisions as there are probable causes.
List the contributors, in rank order, going from left to right. Provide a heading to describe them.

If you have trouble fitting the contributor names on the horizontal axis, label the axis with the letters A, B, C, etc., and provide a key somewhere on the Pareto diagram to list the probable causes names.


Step 6: Draw and label the right vertical axis. The units on the axis should range from 0 to 100%. Line up the 100% point with the grand total on the left vertical axis. At a minimum, show the 50% point on the axis.

The 50% point on the right axis should line up with a value on the left axis determined by the following formula:
Value on X / Grand
Left Axis = 100 x Total

In our example, the grand total is 73, so the 50% point on the right axis should line up with 36.5 on the left axis.
50 /
100 x 73 = 36.5

Provide the heading: "Cumulative-Percent of Total."

Step 7: Draw in the bars to represent the effect of each contribution. The height of each bar should equal the magnitude for that contributor as measured on the left vertical-axis.
Step 8: Draw a line graph to represent the cumulative-percent of total. Plot a point directly above the right-hand edge of each bar at a height equal to the cumulative-percent of total for that category as measured on the right vertical-axis. If you have labeled the axes correctly, the cumulative-percent of total point for the first ranked contributor should be even with the height of the first bar. If not, you have made an error.

Step 9: Analyze the diagram. Look for the break point on the cumulative-percent of total graph; this represents the boundary between the "vital few" and the "useful many." In our example, this break point occurs between the second and third contributors.
Step 10: Interpretation. In most cases, 80% of the problems result from 20% of the causes. This is called the 80/20 rule. This is the basis for a Pareto analysis. The percents do not have to be 80% and 20% exactly. We are looking for significance. If our chart shows an 80/20 pattern, we should brainstorm why these critical bars are contributing to the problem. We may need to collect more information, or a secondary Pareto Chart can be completed to further stratify the category.

Below is an example of an actual stratified Payment Arrangement Pareto Chart that was done by the Service Integration Department for use in their Incoming Billing Call Mix Study. This Pareto shows a category labeled as "OTHER". This is always the last bar shown on the chart (far right) and is used as a catch all for miscellaneous causes that do not amount to more than any shown individual bar on the chart.

If the "OTHER" category is much higher than all the other bars on the chart, the "Other" category has not been broken down far enough. Review the categories in "Other".

Also, if all the bars are about the same height, no significance is shown. If this pattern occurs, further stratify the categories (i.e., types of payment arrangements) or re-evaluate the categories.

Don't forget that Pareto Charts and analysis can be very useful when categorized with dollar amounts per problem. For example 4 problems may result in a thousand dollars, where as 100 problems may only result in $100.00 dollars.
Pareto Charts (attribute data) and Histograms should only be made after you have completed the initial trend analysis and are trying to determine what to do to improve the process. Although the Histogram and Pareto Charts are useful for analyzing process data, the time sequence that the process data occurred in is lost in this analysis. The control chart maintains the time sequence of the data.


If the pattern/trend (determined from control charts) indicates a problem (i.e., probable cause), it is necessary to determine what it is. Use additional problem solving tools (i.e., analysis techniques, SIPOC, Histogram, , etc...) to determine the type of cause (common or special) of the problem. From this information develop a Problem Statement (effect) that can be used for Root Cause Analysis.
SIPOC EXAMPLES CAN BE FOUND @ http://qualityg.blogspot.com/2006/10/quality-tooltechnique-sipoc-cccc.html

AND
http://qualityg.blogspot.com/2006/10/qualitygs-sipoc-analysis-questions.html
FOR INFORMATION ABOUT DATA COLLECTION + EXAMPLE FORMS GO TO (click):
Data Collection + Forms


Pareto Workshop with PAL (Purpose Agenda Limit)


Click on PIC Once to ENLARGE - Then click again on 4 arrows to ENLARGE again


I hope you can utilize my post on Pareto Charts. Let me know if you add anything to make the process better. qg

Tuesday, July 04, 2006

Quality Education - No Way --> "Schools Apply Incentives & Bonuses To Test Scores" - Parents & Teachers Wake-Up

Last year at this time I wrote a post ( http://qualityg.blogspot.com/2005/07/education-qualityq-explodes-his-own.html about State Test Scores improving

Education - qualityq explodes his own Fireworks! "High School MEAP Scores Improve for Reading; Lag in Math, Science, Social Studies and Writing" - WRONG AGAIN!


This year my fireworks are aimed at the never ending saga of "The Demise of American Management in Education." Schools Apply Bonuses & Incentives To Test Scores

See what our business practices (management) are doing, they are spreading the falsehood to our educational system that money is a motivator and that you can only get good qualified people through extrinsic rewards and bonuses.

This assumes that teachers are not self-motivated and not professional and the reason test scores are low is because they don't manke enough money. This is absurd.

They have also transferred the filth that teacher performance will increase if enough money is dangled in front of employees (teachers).

I just finished reading another article that states where another school system is applying bonuses and incentives to teachers in order to improve test scores and enrollment. This is absurd.

We are taking from our teachers and children the chance to experience "Joy of Learning" (Deming). These types of suggestions are alarming to me because the education system is following the same pattern as big business. Incentives, rewards, etc... are extrinsic that drive the wrong behavior.

First of all there is no "Standardization" ( http://qualityg.blogspot.com/2006/07/quality-tooltechnique-standardization.html) among our educational system, in fact even with a school district there is no Standardization within their own schools. Here are some examples:

Incentive plans for teachers
Various states and cities have incentive pay plans for teachers.
Texas has the biggest bonus plan in the country, $260 million to give bonuses of $3,000 to $10,000, primarily based on test scores, to teachers in about 1,000 schools with high numbers of low-income students.
Houston approved $14.5 million for bonuses of $3,000 to $10,000 to teachers whose students raise their test scores.
Wisconsin offers a total of $1.8 million in grants to 20 districts that implement an alternative pay system based on several factors, including test scores, and then report on how well it works.
Florida OK'd $147.5 million to give the top 25% of teachers a bonus of 5% of their salary. The plan is primarily based on test scores.
Iowa has been experimenting with pay-for-performance plans since 2000.
The latest plan rewards all the teachers in a building when the school has met several goals, including higher standardized test scores.
That state's Legislature has allocated $24 million to study the costs and results of performance pay.
Rhode Island's budget includes money to study performance pay for teachers.
Minnesota has an $86-million voluntary plan, offering school districts an additional $260 per child if they pay teachers based on whether they meet performance guidelines.
Denver offers $25 million for a variety of performance pay plans both to teachers and school-wide for student achievement. It also offers bonuses for skills and knowledge and for teachers in high-demand subjects like math and science.
North Carolina will give teachers $750 to $1,500 for meeting or exceeding various benchmarks in student performance.
Chattanooga, Tenn., offers a wide variety of incentives, ranging from money to housing, to attract highly qualified teachers.
Sources: The Education Commission of the States and Free Press research


What affect will this have on the If students? Will they come to view learning as a means to get a reward/incentive? Will they will no longer identify learning as something worth doing for the long-term (whole life).?

American Management still believes rewards and incentives are the way to motivate employees to do a better job. At best, rewards will get some temporary reaction, but it does not last, nor does it change behaviors for the long term and it does more harm than good. Same thing will happen in education. Parents & Teachers Union PLEASE DO NOT LET THIS HAPPEN!!


It doesn't matter whether or not it is business or education, granting performance for pay takes the employees (teachers) focus off the target/aim of education and puts it on extrinsic rewards that caujealousyosy, envy and poor working relations.. We need cooperation before there can be competition.

You are going to use Standardized Tests as a measure? You have got to be kidding. Have you ever heard of variation? Example, a sixth grader finally gets a good score on a standardized test. Do you reward the sixth grade teacher only? What about the 5 previous teachers, does this mean they were all bad, why would they not get a bonus? What if there are 3 sixth grade teachers, do they all get a bonus or just the homeroom teacher?

By What Method will you use the Standardized Tests to score excellence? That is ridiculous, your tests scores do not reflect the overall goal of education and that is to teach children knowledge and skills, not to pass tests that are flawed and biased depending on what school system you live in.

Our current educational system is broken and will continue to get worse with ideas like this coming into education. If you don't believe me study our American Management System.


Question for teachers? When grading papers (not tests) do you say why can't this student understand, or do you ask does the student need extra help or specialized help? Do you ask yourself how to improve your own teaching methods? Do you just say "Oh well?"

Warning for teachers - Have you ever heard of Rating & Ranking (I call them Nasty 1 and Nasty 2)? Read my post @ http://qualityg.blogspot.com/2005/06/leadership-performance-appraisal.html. I'm guessing many of you have in some way from friends and family. Actually you rate and rank students based on test scores (how sad).

What about "Forced Distributions"? This is Nasty 3 and not as well known as Rating (Nasty 1) and Ranking (Nasty 2). Let me tell you what this means, they will eventually put you into groups and sub-groups (? - has anybody in management done a cost-benefit analysis to see how many systems and admin people will have to be hired to make sense of all this).

What happens next is if your group (high test scores and attendance) you will get a percentage raise (big, big mistake) or a bonus? What if one group only has higher attendance, they will also get an increase but not as much as group 1.

You see consultants and higher education types will convince your management that you must have a bell shaped curve. This way some of you are winners and some of you are losers. It all depends on variation (special or common, I know, I know what is this?).

So next year, knowing your that Johnny's little brother will be in your grade do you just roll the dice or do you say no way because Johnny missed 12 days od school because his Dad overslept and he missed the bus?

What about Jenny's little sister who is also moving into your grade and the mother wants you again for her teacher. Problem is you know from the little sister's teacher that she scored so low on the state tests that she was one of the big reason she did not get a raise.

Think about these basic scenarios - PLEASE!

AFT and other teacher unions do not be like the UAW and wait for things to happen and then scream and cry to your membership. Plan and be preventive.

Be a Voice and Not an Echo!

Other Educational posts by qualityg:

http://qualityg.blogspot.com/2006/07/quality-education-high-school-college.html

http://qualityg.blogspot.com/2006/04/quality-education-see-update-41106-am.html

http://qualityg.blogspot.com/2006/07/quality-education-failing-school.html

Saturday, July 01, 2006

"Standardization" for Education, Business & Government

"Standardization" is a critical factor that is constantly overlooked because of inadequate management, project planning, sense of urgency (it takes too long), geographic locations and poor communication mediums.

Business Companies, Educational Instituitions and Governmental Agencies are constatly laying out plans (well some do) to scale back in one way or another. They often do this with no idea that people coming (cheaper wage) in or now doing more than one job must have standardized methods and procedures, work tasks, job aides and up to date manuals to do a job correctly. If not, you are just cutting your throat deeper.

The only time I saw a company try and get standard work procedures was before a strike so that management could keep operations running smoothly. At the same time, union employees were hiding work tasks or bringing out outdated procedures.

The problem is not just in Business one, Governmental and Educational Systems have no idea when they continuously develop and delegate down new procedures, targets and measurements based on some new expert or governmental (i.e., No Child Left Behind, State educational tests and improvement programs) mandate that changes when new people are elected to government or school boards.

One of the main problems is no one/agency removes the previous mess because they don’t want to be associated with a failed plan or they just don’t understand it, their new ideas will fix the problem and they will have it done during their term in office.

Sub-optimization is rampant in our business, governmental and educational systems. It’s everyone/agency doing their best, but they have no idea where to start. I suggest Standardization. You must get control of your system before any improvement can take place. Designing new systems/processes that contradict current or previuos ones will result in failure.

The following write-up is on Standardization, why it is important and what key elements make up Standardization.

My experience with Process Improvement Teams has proven there can be no long-term effective improvement without standards. Standardization is the starting point and the ending point for continual improvement.

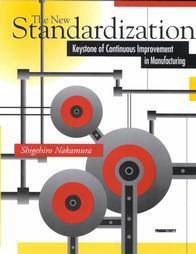
Dr. Nakumura a leading expert on Standardization stated:


" If you simply implement standardization without first making improvements, you will only establish more firmly the problems that exist in the current system. The correct approach to standardization begins with setting a course for higher levels of operations and standardizing improved methods rather than current methods.

Standards are not meant to last forever... standardization should be optimistic: there is always room for improvement. Perfect standards do not exist at any company."
Shigehiro Nakumura


Based on this information and my experiences I would define Standardization as follows:

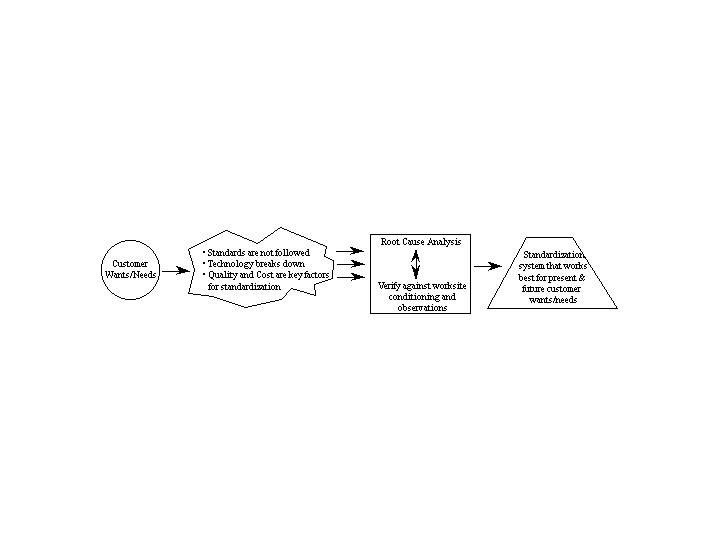
Standardization is a disciplined process that maintains the gains as well as provides a means for continual process improvement by applying methods, measurements (stability, capability), and procedures in a systematic fashion that prevent a process from reverting to old ways and root cause from reoccurring.

Simply stated "standardization" is making sure that the good effects of our systems are not lost through neglect, forgetfulness or organization changes. Standardization/Empowerment without parameters equal CHAOS!

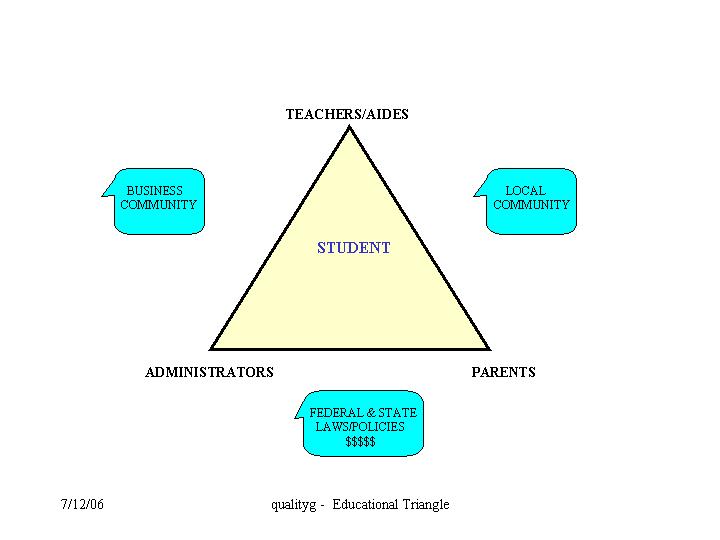
Why then is Standardization important? Quality/Process training has taught us that many of our current processes, and especially those that have been in place for a while have probably deteriorated over time. There is little doubt that everyone is working hard and doing what they think is right, but in many cases there is no clear sense of direction, or the knowledge or understanding of what is driving the complete process, let alone one's own piece of the process.

CLICK PIC TO ENLARGE PICTURE


Standardization helps employees (i.e., teachers) and work groups drive in the same direction and toward the same goals, which is vital to exceeding customer expectations and student success. Benefits of standardization include:

• Educating employees (i.e., administrators) in identifying their customer
and supplier expectations

• Providing up to date documentation, standards and procedures created by employees/teachers who do the work

• Reducing rework

• Creating proactive vs. reactive opportunities for improvement by assuring stability and capability

• Identifying and clarifying critical processes based on customer/educational expectations

• Enabling better coordination among work groups within the organization

• Promoting systematic identification and removal of root causes that inhibit process improvement

• Assuring decision making is based on facts and subject matter expertise
that is required for making sound decisions about redesign and implementation

• Guarantees achievement of Process Improvement in less time, and with less rework, that provides lasting results

Basically there are four major elements that are required for Standardization to take place:

1) Develop a Strategic Plan that Analyzes and Prioritizes critical processes for Standardization. Remember, you don't have to Standardize the total process, look for sub-processes most in need based on customer wants/needs.

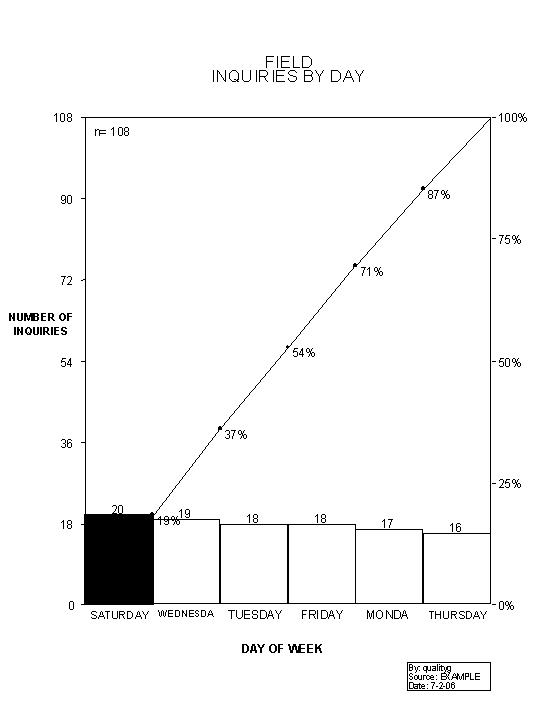
TOOLS/TECHNIQUES: Strategic Plan (Hoshin)

Five Ws (Who, What, When, Where Why) and One H (How)

Standards Procedure Checklist (see below)

2) Lack of Communication is one of the main reasons for confusion and neglect when new standards are introduced. Everyone must own and operate within the process. This is especially true when trial implementations are in effect. If one district, (location) department or center is doing things by the new method and another department, district or center is doing things by the old, communication is the key to measure the result.

3) Adequate and continual Training and Education must be done in order for standards to be effective. No matter how good the standards, procedures, measurements and methods look on paper they will not benefit the employee/teacher, employer/administrators and most importantly the customer/student unless all the critical parties are involved in the process from end-to-end are covered. Remember, most people learn their work by seeing and doing, not by reading big manuals or countless Emails and Handouts.

4) Accountability and Responsibility are crucial to Standardization. Evidence has repeatedly shown that problems will initially be solved only for the same problem to reoccur later. The major cause of this is that standards were observed at first, but eventually were allowed to deteriorate because of lack of discipline. A system of responsibility must be set up to assure that PDSA (Plan, Do, Study, Act – Shewhart & Deming) continue to happen on each critical process.

Without proper standardization there is a constant need for management/supervision to instruct, watch, inspect and monitor the work process very closely. Instead we must create a standardization process that is both customer focused and employee-oriented. By changing the perspective of our process improvement efforts from tasks and procedures to customer outcomes, and by putting the process directly into the hands of the workers/teachers rather than rocket scientist documentation, we can create a definition of value added activity that guides employees to continuous process improvement. Oh yeah, keep politicians out of the process!


STANDARDIZED PROCEDURES CHECKLIST


The following procedural checklist provides the basic steps for a Process Team or Work Group to standardize strategic work processes:

1) Define and Identify Critical Work Processes that are in accordance with corporate strategies and goals.

2) Of these, prioritize which work processes do not consistently meet customers’ needs and expectations and select a Top Priority Process by evaluating:

• Impact on Customer (Ext/Int)
• Impact on Business
• Need to Improve

3) Select appropriate employees (work group) doing the job as well as those supplier support functions (i.e.; M&P, IT, Sales, Marketing, Training, Operations) to describe the work process and gather existing:

• Job Aids
• Procedures/Work Flows
• Standards/Manauals
• Checklists
• Job Descriptions
• Training Documentation
• System Code (if applicable)

4a) Develop process flowcharts reflecting how work is currently being done.

• Determine if workflow and employee practices are consistent with existing Procedures, Standards, Job Aids, Checklists, Training Documentation, Work Flows and Job Descriptions.
• Determine degree of consistency of employee practices within the work group through observations and interviews or Quality System Assessments.

4b) Identify Suppliers (INT/EXT) and your expectations of them (Inputs).
Identify Customer (INT/EXT) expectation (Outputs). Use SIPOC Model.

4c) Select best workflow and employee practices based on group consensus. Document new Procedures and Standards to reflect changes.

5) Develop upstream Process and outcome Result (Quality) Indicators. These indicators should be based on customer expectations and be:

• Measurable
• Verifiable
• Cost Effective
• Tamper Proof
Use indicators to determine baseline performance.

6) Systematically collect data (indicators) to determine on-going performance. Analyze process performance; determine if work process consistently meets customer expectations.

• Process is Stable
• Process is Capable

Note --> Remember that a process can be stable but not capable. Stable does NOT always mean good.

7) As opportunities arise through end-to-end analysis and performance indicators, implement and verify solutions (downstream effects). Standardize across work groups. If problem s are more complex and requires further analysis establish a Process Improvement Team.

8) Determine Process Flexibility, if work process cannot be improved (i.e.; ECRS methodology) to meet current or "anticipated future" customer/student expectations consider total redesign of the work process.

• E = Eliminate
• C = Change/Add
• R = Rearrange
• S = Simplify

Continuously share work process innovations, lessons learned and new procedures with appropriate work groups (i.e., suppliers/parents, internal customers/teachers, similar functional groups). Consider these elements:

• Methods & Procedures updated
• Simplification - measure essential indicators only
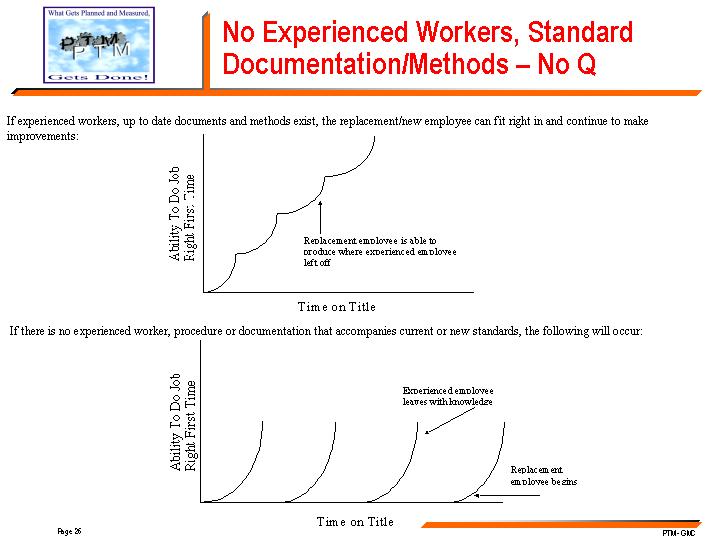
• Train employees actually doing the job

Note --> This is critical if you are losing experienced employees because of downsizing, early retitements, and buyouts. The graph below expalins this scenario.

CLICK PIC TO ENLARGE PICTURE


Note: --> Do not get fooled into thinking the Internet has solved this problem. The Internet only speeds up the process, it does not know if something is Standard or not, it still comes down to people.
How about the importance of Standardization in Education?
According to a new report on statewide testing released today by the American Federation of Teachers (AFT), most states have made progress in developing clear grade-by-grade standards, but many have not aligned their high-stakes math, reading and science tests with a strong set of content standards, which leads to a distorted picture of how students, schools and teachers are performing.
Click here for the complete report and state by state breakdown - http://www.aft.org/presscenter/releases/2006/smarttesting/index.htm